Scatchard equation
The Scatchard equation is an equation for calculating the affinity constant of a ligand with a protein. The Scatchard equation is given by
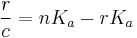
where r is the ratio of the concentration of bound ligand to total available binding sites, c is the concentration of free ligand, and n is the number of binding sites per protein molecule.
Ka is the association (affinity) constant from the equation
![K_a = \frac{[Ab-Ag]}{[Ab][Ag]}](/2012-wikipedia_en_all_nopic_01_2012/I/70fd513ec918c295f9599df626719260.png)
where Ab is the binding site on the antibody, Ag is a monovalent antigen, and Ag-Ab is antigen-bound antibody.
The Scatchard equation is sometimes referred to as the Rosenthal-Scatchard equation.
Plotting this data, r/c vs r, yields the Scatchard plot with a slope -Ka and a Y-intercept of nKa. Relative binding affinities between two sites can be distinguished with a line showing identical affinity and a curve showing different affinities.
The Scatchard equation is named after the former MIT Chemistry Department member George Scatchard, an American chemist, 1892–1973.
A real-life example: A binding experiment using a regular spectrophotometer is a real-life application of this equation. Here we define the change in absorbance at differing concentrations of ligand as delta A (at a constant wavelength, typically whichever one gives you the largest number). The concentration of the protein is held constant, and the absorbance is measured at different concentrations of total ligand until everything is saturated. The fraction saturation (represented by the Greek letter θ) is equal to the absorbance minus the absorbance when the ligand concentration is zero, divided by the absorbance at saturation minus the absorbance when the ligand concentration is zero. Or to put it another way, 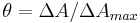 Now we have to take into account the number of binding sites per molecule of protein. This requires a second equation
  where n is the number of binding sites. If you don't know the number of binding sites, take
  to equal the amount of ligand bound (assume all ligand binds until saturated, and throw out the point where it is saturated) divided by the total protein. If you plot
 ![\nu/[L]](/2012-wikipedia_en_all_nopic_01_2012/I/82cd6b77824cf691482ea794d720b35f.png) versus you will get a nice linear plot with a slope equal to -Ka, a y-intercept of nKa, and an x-intercept of n. CAUTION!!! If you wind up with a data set that is NOT linear by the Scatchard plot, you have COOPERATIVITY. In case of cooperativity, please see the Hill equation (biochemistry).
versus you will get a nice linear plot with a slope equal to -Ka, a y-intercept of nKa, and an x-intercept of n. CAUTION!!! If you wind up with a data set that is NOT linear by the Scatchard plot, you have COOPERATIVITY. In case of cooperativity, please see the Hill equation (biochemistry).